Changes in the Performance of Texas Gas Wells
Gary S. Swindell, SPE, Petroleum Engineering Consultant. Copyright.
Other Charts and graphs from SPE 70018
Note: This study was updated through 2005 new wells - some of the plots were updated here.
Click here to see the new 2005 data summary.
Prior 1999 acticle in the Oil & Gas Journal.
Copyright 2001, Society of Petroleum Engineers Inc.
This paper was prepared for presentation at the SPE Permian Basin Oil and Gas Recovery Conference held in Midland, Texas, 15–16 May 2001.
This paper was selected for presentation by an SPE Program Committee following review of information contained in an abstract submitted by the author(s). Contents of the paper, as presented, have not been reviewed by the Society of Petroleum Engineers and are subject to correction by the author(s). The material, as presented, does not necessarily reflect any position of the Society of Petroleum Engineers, its officers, or members. Papers presented at SPE meetings are subject to publication review by Editorial Committees of the Society of Petroleum Engineers. Electronic reproduction, distribution, or storage of any part of this paper for commercial purposes without the written consent of the Society of Petroleum Engineers is prohibited. Permission to reproduce in print is restricted to an abstract of not more than 300 words; illustrations may not be copied. The abstract must contain conspicuous acknowledgment of where and by whom the paper was presented. Write Librarian, SPE, P.O. Box 833836, Richardson, TX 75083-3836, U.S.A., fax 01-972-952-9435.
The complete set of Profiles of Average Texas Gas Wells - 1971 - 1998
Abstract
Much attention has been recently given to depletion of U.S. natural gas reserves, particularly since many forecasts predict a 30 TCF annual gas market. A comprehensive look at the way initial production, decline rates, and reserves have changed over the last 30 years in Texas, the source of 1/3 of the country’s natural gas, leads to concern about whether current drilling activity will be able to maintain the current supply, much less increase gas production 1. The decline rates in new Texas gas wells have changed from about 20% in the first year for wells drilled in the 1970’s and 1980’s, to more than 55% for wells drilled in 1998 and 1999. At the same time, the contribution to the state’s supply from new wells has sharply increased from 8% of the state’s supply to more than 15%. Although the initial production rates from an average well have actually improved from a low of 15 MMCF per month in the early 1980’s, to 44 MMCF per month in 1999 due to improved completion technology and horizontal drilling, the combined effects of fewer completions and high decline rates suggests that a decrease in Texas’ production capacity may occur in the near future. Drilling above the current activity will be necessary to sustain the state’s gas production. Normalized rate vs. time curves were developed for each year since 1970 to obtain initial rates and decline profiles. The curves were extrapolated to an estimated ultimate recovery, changing from 6 BCF per well in the early 1970’s to 1 BCF per well in the late 1990’s.
Introduction
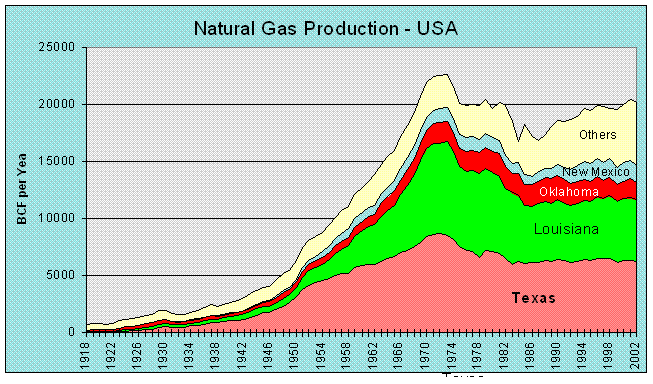
Texas has been the source of 39% of the approximately 882 TCF marketed in the U.S. since 1945. The state currently supplies about 32% of the country’s natural gas and holds 27% of the proved reserves 2. By any measure its contribution to the U.S. supply is significant.
 class=shape v:dpi="96">
Figure 1 – Historical natural gas production.
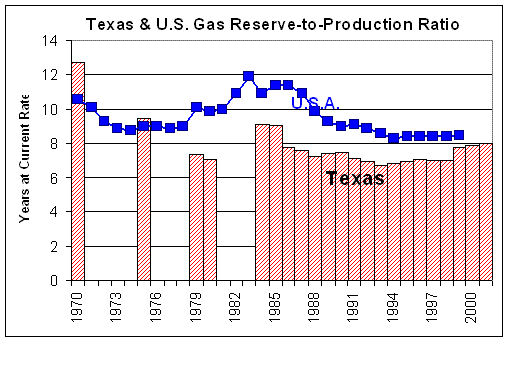
Natural gas reserve-to-production ratios have been fairly constant in recent years for both the U.S. and Texas, and stand at 8.7 years and 7.4 years, respectively, for the year ending in 1999.
 class=shape v:dpi="96">
Figure 2 – Reserve to production ratios.
After showing a decline from about 1974 to the early 1980’s, gas production in Texas has been fairly constant at about 510 BCF per month (6,200 BCF per year). But that production rate has been maintained by more than doubling the number of gas wells. Active gas wells increased from 23,700 in 1970 to 59,000 at the end of 1999.
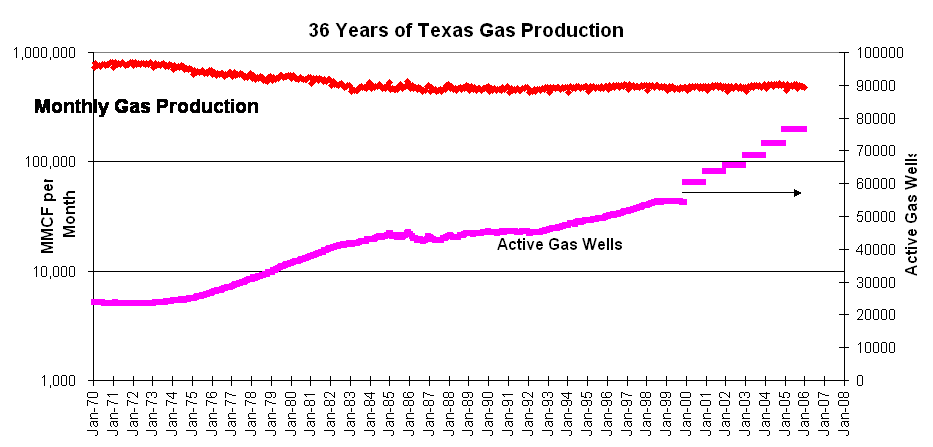
Figure 3 – Texas gas production and well count.
Since the state’s gas production has been sustained by new wells, it becomes important to understand how those new completions are performing in order to indicate whether the current volumes are sustainable given the drilling activity levels. This study focused upon the changes in the performance of new gas wells.
Methodology
The study was limited to only Texas gas completions from 1971 through 1999, the latest full year in which production data was available. Although casinghead gas production from oil wells was not included in the study, that gas comprises about 18% of the total Texas production, a percentage that continues to decrease. Since the state tracks casinghead gas production on a lease basis rather than by well, it makes it difficult to analyze the performance of new wells separate from old. Wells in state waters were included in the data set but Federal offshore leases were not. For the most part, a gas completion represents a single well in the way production data is reported to the Texas Railroad Commission (RRC). There are certainly instances of multiple completions in the data sets but many fields in the state allow either commingling or the combining of multiple reservoirs as a single completion. In this study the data source is the production volumes as reported to the RRC, generally on a well basis and the term “well” is used interchangeably for “completion”. For each year from 1971 to 1999, the new gas completions for those years were segmented into single year “classes”. Those “classes” ranged from a maximum of 6,034 completions in the class of 1982 to a low of 1,934 in 1971. Typically the class size was in the 3,000-4,000 range.
The monthly gas production for each “class-year” was normalized to the same time-zero and divided by the active well count for each month to produce an average “type” well for each year. The result was the generation of 29 rate vs. time profiles, showing how the average well that was completed in each year has performed.
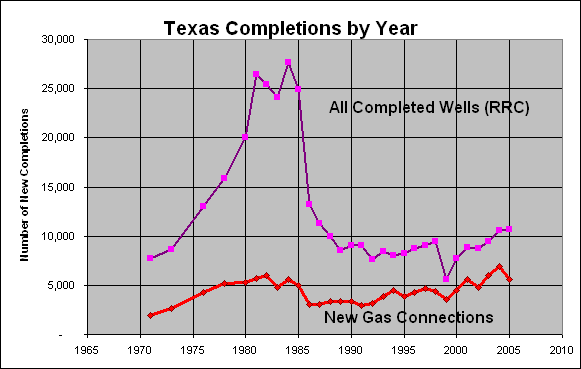
Figure 4 – Texas completions.
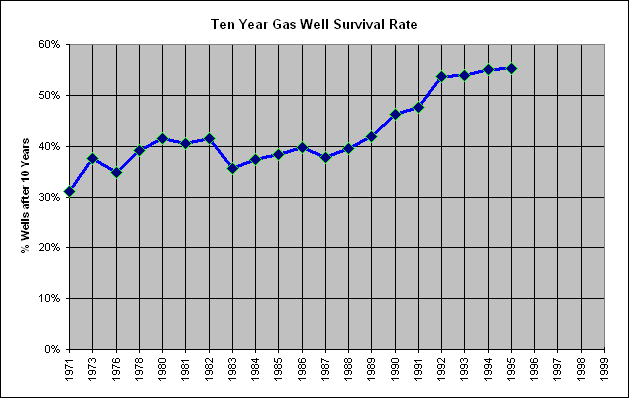
Figure 4b - Gas well completions and survival rate.
Selected Rate vs. Time Plots
The complete set of Profiles of Average Texas Gas Wells - 1971 - 1998
Figure 5 shows the performance of the average gas well drilled in Texas in 1971. Note that the production probably was limited due to proration in the earliest years.

Figure 5 - The average well for 1971.
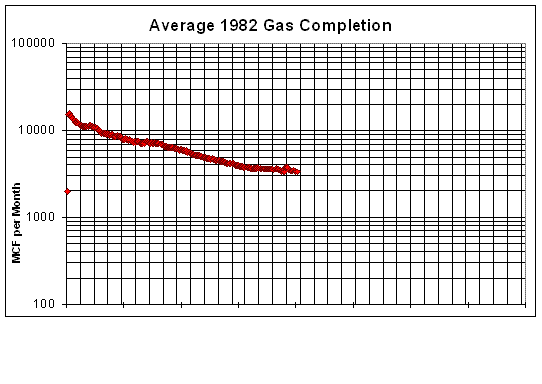
Figure 6 – Average 1982 well; lower initial, increased decline.
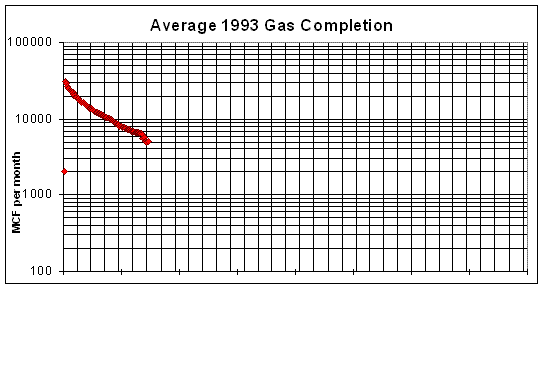
Fig. 7 – Avg. 1993 well - higher initial rate, much higher decline.

Fig. 8 – Average 1996 well - higher first year decline.
Three selected production decline profiles are shown in Figure 9 for the years of 1971, 1980 and 1996. It is clear that although the initial well productivity increased from 1980 to 1996, depletion is taking place at a faster rate and the expected life of the newer wells will be much shorter than older vintage wells. The newer wells consistently show more hyperbolic tendencies but with significantly steeper decline rates in the early years. This pattern is evident throughout each class-year of gas wells.
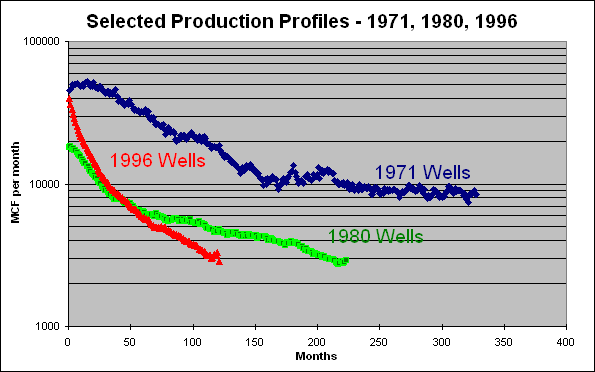
Figure 9 – Composite decline profiles for 1971, 1980 and 1996.
The complete set of Profiles of Average Texas Gas Wells - 1971 - 1998
Summary of Study Results
Initial Production
The initial production showed dramatic changes (figure 10) over the study period. Initial production was the highest actual monthly production, generally the first or second month. Wells drilled in 1971 averaged 52,324 MCF per month (1,720 MCFPD) in their first full month. Average initial volumes dropped significantly to a low of 15,601 MCF/month in 1983, then began a trend of increases through 1999. Other studies3 in specific fields have shown similar increases.>The increases beginning in 1989 correlate to the implementation of horizontal drilling, especially in the Austin Chalk Trend. Increases prior to that are likely due to improved, high volume fracturing technology and high productivity in South Texas wells.

Fig. 10 – Average initial production
Decline Rate
Although the initial rates have actually improved in recent years (figure 11), the rates of decline in production have dramatically changed for the worse. In the 1970’s the first-year decline averaged 16% per year, and the five-year overall decline rate averaged about 15% per year. But in the late 1980’s the first-year decline rate began a sharp increase to the present 56% per year. Furthermore, the five-year average decline (figure 12) also increased to 28% by 1994. Certainly the sharply higher decline rates were due in part to the influence of Austin Chalk horizontal drilling but there were other factors including drilling in partially depleted or interfering reservoirs, step-out drilling in poorer areas of existing fields and the ability of 3-D seismic to find small accumulations. Bob West Field, for example, was discovered in the early 1990’s in the Wilcox trend. Gas production from this field did increase through 1996 but has fallen sharply since, even as wells were added to the field total. McAllen Ranch (Hidalgo County), Double A Wells (Polk County), and Carthage (Panola County) fields among many others show a decline in gas production even in the face of added drilling.
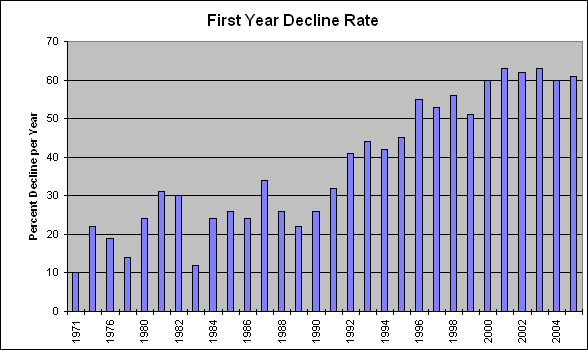
Figure 11. Average first year decline rate.
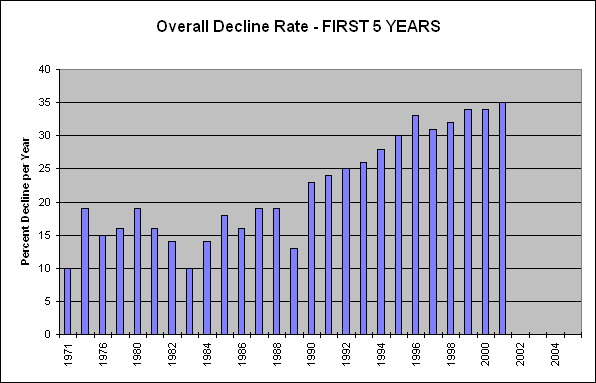
Figure 12. Average five year decline rate.
Ultimate Recovery
The average rate-vs.-time plot for each class-year of wells was used to project an ultimate gas recovery, assuming operating costs of $1,600/well/month, $4.00/mcf gas price and 80% NRI. Average projected recovery declined from 6,245 MMCF per well in 1971 to 1,019 MMCF per well in 1998. The trend shows a slow decrease in ultimate gas recovery since 1980. These figures for Texas wells are in fair agreement with the data from the Energy Information Administration (E.I.A.)2 which indicate additions from extensions and new discoveries of 10,807 BCF in 1999 (extensions + new discoveries) as a result of the completion of 9,621 new gas wells or an average addition of 1,123 MMCF per well for the entire U.S. The E.I.A. data includes high reserve offshore wells that likely carry higher reserves than those in the study group.
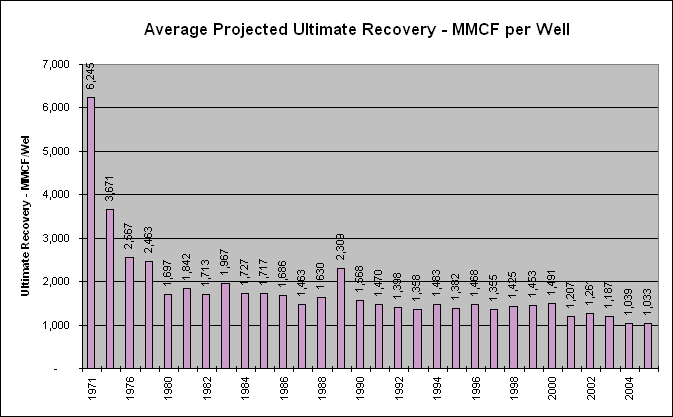
Figure 13. Average estimated ultimate recovery.
Contribution of New Wells
In addition to a trend of higher initial production, significantly higher decline rates and lower ultimate recovery, the new wells are contributing more to the Texas gas supply. Figure 14 shows the proportion of gas produced in each year that came from wells completed in that year. Until the early 1990’s, typically 8% of the gas production came from new wells drilled that year. But since 1993 that percentage has increased sharply to about 15% of the state’s gas supply coming from new wells.
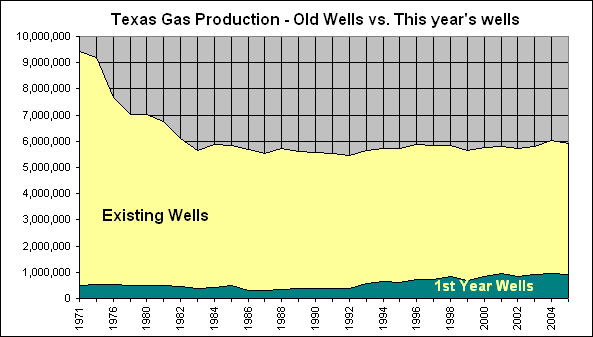
Figure 14a. Gas from new wells vs. old.
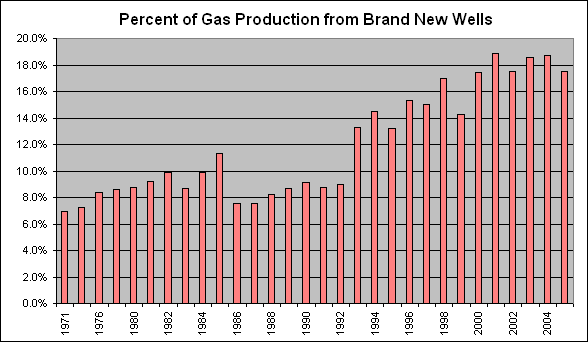
Figure 14. Percent of gas from new wells.
A Closer Look at Texas Production
Although figure 3 appears to show little or no decline in gas production from Texas wells, a closer look is in order. Figure 15 shows the same production data with a larger y-axis over just the last 10 years.
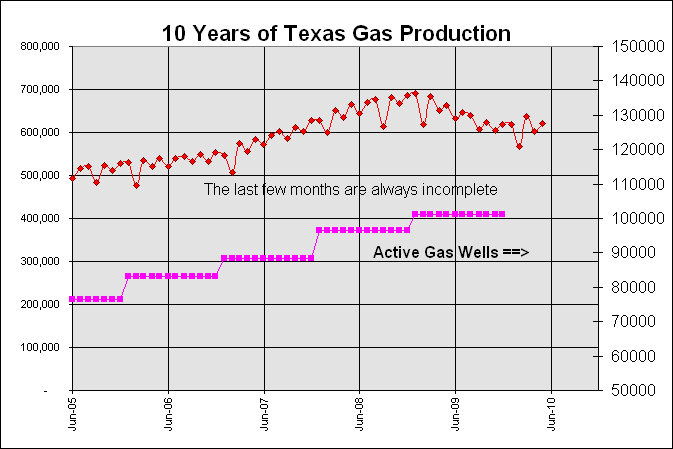
Figure 15. Last 10 years of Texas gas production.
Note that the peak production over the last 10 years occurred in January, 1997. Since then a trend of decline, during a generally strong gas market, may be developing.
Conclusions
There have been substantial changes in the decline profiles of wells drilled in Texas over the last 30 years. This study indicates that for new Texas gas wells, the decline rates in the early years are now on the order of 50% per year. Improved drilling and completion technology have increased the initial production from the wells. Reserves developed per completion are about 1 BCF per well and show a continuing slow decrease. At those average reserves, volumetric replacement of the state’s annual gas production requires the completion of an estimated 6,100 new gas wells compared with only 3,566 new gas wells in 1999 and 4,580 new gas wells in the year 2000. (Casinghead gas from oil wells, which was not part of this study, also contributes to gas additions). Without an increase in the number of completions, the combined effects of poorer wells, contributing an increasing percentage of the Texas gas supply may make it difficult to sustain the state’s gas production.
The complete set of rate vs. time plots, along with additional supporting data is available at http://garyswindell.com.
References
1. Swindell, G.S., “Texas production data show rapid gas depletion”, Oil & Gas Journal, June 21, 1999, pg. 51.
2. DeGolyer and MacNaughton, Twentieth Century Petroleum Statistics, Dec. 2000. Data from the Energy Information Administration (E.I.A), United States Department of Energy.
3. Swindell, G.S., “Reserves and Performance of Canyon Sand Gas Wells 1970-1994”, SPE paper 35204, presented at the Permian Basin Oil & Gas Recovery Conference, Mar. 27-29, 1996, Midland.
4. Simmons, M.R. and Pursell, D.A., Depletion: The Forgotten Factor in Supply and Demand, Offshore Magazine, Feb., 1999, p 30.
5. Lohrenz, J. and Williams, C.W., “Disaggregated Remaining Reserves to Annual Production Ratios”, SPE paper 52944, presented at the Hydrocarbon Economics and Evaluation Symposium, Dallas, March 20-23, 1999.